
N.C. OCME Annual Report 1994
Back to Annual Report Index | Chapter 7
Chapter 6: Motor Vehicle Accidents
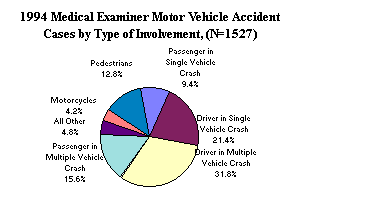
Of the 2,675 deaths that were ruled accidental in manner, 1,527, or 57 percent, involved motor vehicles. Figure 18 shows that drivers involved in a collision with another motor vehicle comprised 31.8 percent of the deaths, followed by drivers not involved in a collision with another vehicle (21.4%) and passengers involved in a collision with another motor vehicle (15.6%). Of the 1,186 drivers and passengers killed in single-or multiple-vehicle crashes, 496, or 41.8 percent, were known to be using a seat belt or other restraint.
Figure
18
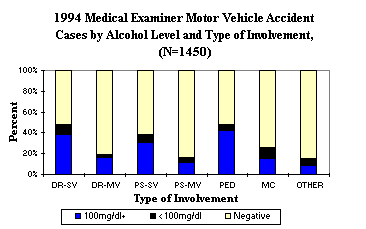
The percentages of alcohol use for each type of motor vehicle accident deaths are shown in Figure 19. Alcohol was a major factor among drivers in a single-vehicle crash, pedestrian and vehicle accidents, passengers in a single-vehicle crash, and motorcycle crashes.
Figure
19
DR-SV
= Driver, Single Vehicle PS-SV = Passenger, Single Vehicle
DR-MV
= Driver, Multiple Vehicle PS-MV = Passenger, Multiple Vehicle
PED
= Pedestrian MC = Motorcycle
Table 9 reveals that in 1993 and 1994, the percentage of drivers in single-and multiple-vehicle crashes who had been drinking declined. Pedestrian alcohol use has also declined.
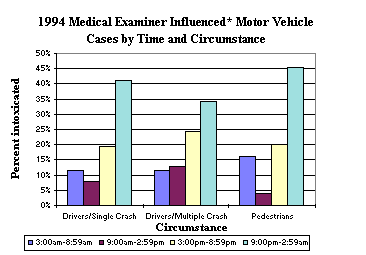
The percentages of intoxicated decedents (defined as having a blood alcohol level of 100mg/dl or more) by circumstance and time of injury are shown in Figure 20. The time period 9 p.m. - 3 a.m. had the highest percentage of intoxicated decedents in all circumstances. It is striking that in that time period, almost one half of fatally injured pedestrians and over one third of drivers of single vehicle fatalities had blood alcohol levels at or above DWI levels.
Figure
20
*Tested
alcohol level >=100mg/dl
Table 9: 1990-1994 Medical Examiner Motor Vehicle Driver and Pedestrian Fatalities By Year, Circumstance, and Alcohol Level
| Circumstance | 1990 | 1991 | 1992 | 1993 | 1994 | Total |
|---|---|---|---|---|---|---|
| Drivers in Single Vehicle Crashes | ||||||
| Sober | 122 (36%) | 126 (42%) | 132 (44%) | 160 (51%) | 153 (52%) | 693 (45%) |
| Drinking | 26 (8%) | 15 (5%) | 22 (7%) | 20 (6%) | 28 (9%) |
111 ( 7%) |
| Influenced | 192 (56%) | 160 (53%) | 145 (49%) | 136 (43%) | 114 (39%) |
747 (48%) |
| Number Tested | 340 (89%) | 301 (88%) | 299 (89%) | 316 (94%) | 295 (91%) |
1,551 (90%) |
| Deaths | 381 | 343 | 336 | 337 | 325 |
1,722 |
| Drivers in Multiple Vehicle Crashes | ||||||
| Sober | 291 (80%) | 264 (81%) | 276 (84%) | 364 (85%) | 357 (81%) |
1,652 (87%) |
| Drinking | 15 (4%) | 9 (3%) | 14 (4%) | 19 (4%) | 14 ( 3%) |
71 ( 4%) |
| Influenced | 60 (16%) | 53 (16%) | 40 (12%) | 48 (11%) | 70 (16%) |
271 (14%) |
| Number Tested | 366 (85%) | 326 (86%) | 330 (86%) | 431 (90%) | 441 (91%) |
1,894 (88%) |
| Deaths | 432 | 379 | 383 | 479 | 485 |
2,158 |
| Pedestrians | ||||||
| Sober | 85 (48%) | 79 (45%) | 65 (38%) | 91 (52%) | 91 (52%) |
411 (47%) |
| Drinking | 10 (6%) | 5 (3%) | 10 (6%) | 10 (6%) | 10 ( 6%) |
45 ( 5%) |
| Influenced | 82 (46%) | 90 (52%) | 96 (56%) | 74 (43%) | 75 (42%) |
417 (48%) |
| Number Tested | 177 (89%) | 174 (87%) | 171 (92%) | 174 (97%) | 176 (91%) |
872 (91%) |
| Deaths | 199 | 199 | 185 | 180 | 194 | 957 |
| Sober = < 20 mg/dl Drinking = 21-99 mg/dl Influenced = > 100 mg/dl | ||||||
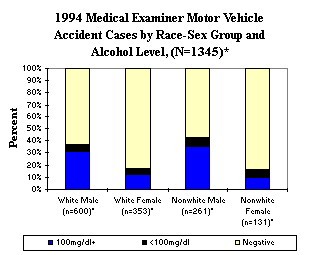
Table 10 shows motor vehicle accident death rates by race and sex. Nonwhite males had the highest death rate; death rates for males was nearly double that of females. Alcohol involvement was most common in motor vehicle accident deaths involving males, white and nonwhite (Figure 21).
Table 10: 1994 Medical Examiner Motor Vehicle Accident Death Rates by Race and Sex (per 100,000 population)
| White | Nonwhite | Total | |
|---|---|---|---|
| Male | 25.9 | 35.9 | 28.2 |
| Female | 15.0 | 16.1 | 15.3 |
| Total | 20.3 | 25.3 | 21.6 |
Figure
21
*Total
tested for alcohol
Motor vehicle accident death rates by age and the age-specific percentage of motor vehicle accident deaths by alcohol level are shown in Figures 22 and 23 respectively. The age group 15-24 had the highest death rate, while the age group 25-34 had the highest percentage of victims intoxicated. Alcohol was common in all but the 65+ age group.
Figure
22
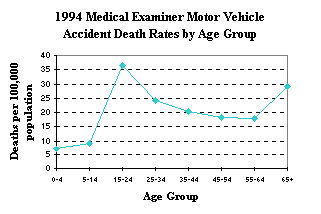
Figure
23
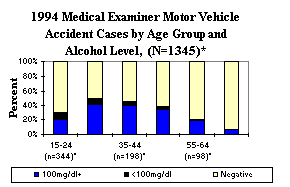
*Total
tested for alcohol
Figure 24 shows that the highest number of deaths occurred between the hours of 4 p.m. and 10 p.m. Non-drinking victims were killed primarily during daylight hours; while drinkers died between 9 p.m. and 3 a.m. Figure 25 shows that fatal accidents were most common on weekends.
Figure
24
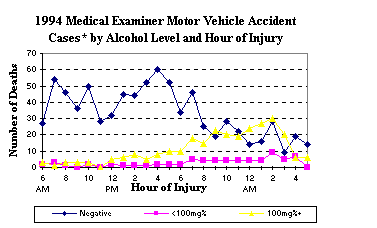
*Total
tested for alcohol
Figure
25
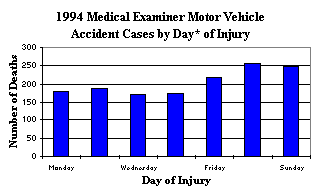
*Day
runs from 6:00am -5:59 am