
N.C. OCME Annual Report 1994
Back to Annual Report Index | Chapter 5
Chapter 4: Homicides
Although homicides represent only 10 percent of all medical examiner cases, their identification and investigation is one of the more important contributions that the system provides the state. In some instances it is only the medical examiner's investigation that uncovers a homicide in what might otherwise have seemed an unsuspicious death. Just as important, it may exonerate the innocent when what initially appears to be a suspicious death proves to be otherwise. The information uncovered at the autopsy that is performed in all suspected homicides is often critical in the authorities' investigation and essential for the successful prosecution (and at times the defense) of the case.
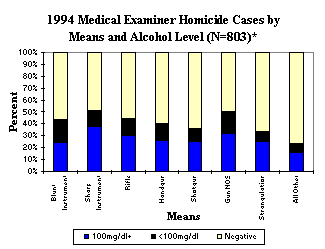
Figure 3 shows that firearms account for over two-thirds of all homicides, the majority of which are handgun deaths. Figure 4 breaks down homicides by means and alcohol levels. Victims killed by and sharp instruments unspecified guns were most likely to have alcohol in their system, but alcohol was clearly involved in a significant number of all homicides.
Figure 3
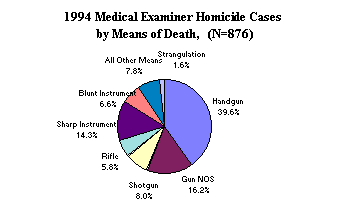
Figure 4
* Total number tested for alcohol
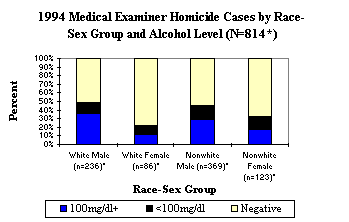
Homicide death rates by race, sex, and age group are shown in Table 7 and Figure 5. The homicide rate for nonwhite males, as shown in Table 7, was five times the rate for white males. Nonwhite females also showed disproportionate victimization compared to their white counterparts. Percentages of alcohol use for each race-sex group are shown in Figure 6; alcohol intoxication was most common in male homicide victims.
Table 7: 1994 Medical Examiner Homicide Death Rates by Race and Sex (per 100,000 population)
| White | Nonwhite | Total | |
|---|---|---|---|
| Male | 9.6 | 50.0 | 19.0 |
| Female | 3.5 | 14.2 | 16.1 |
| Total | 6.5 | 30.9 | 12.4 |
Figure 5
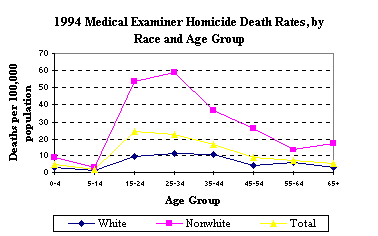
Figure 6
*Total number tested for alcohol
Figure 5 also shows that most of the excess homicide mortality in nonwhites is between ages 15-44 years. Homicide death rates by age and the percentages of alcohol use for each age group are shown in Figures 7 and 8 respectively. The age group 15-24 had the highest homicide rate, while age group 35-44 had the highest percent of alcohol intoxication.
Figure 7
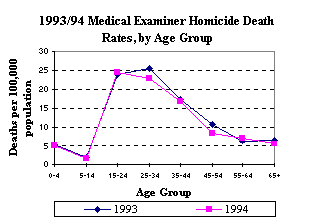
Figure 8
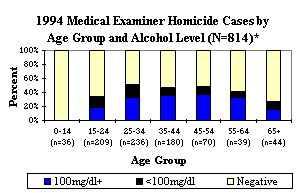
*Total number tested for alcohol
Figure 9
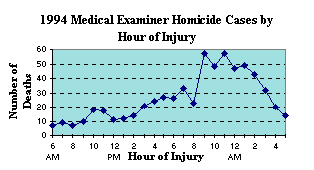
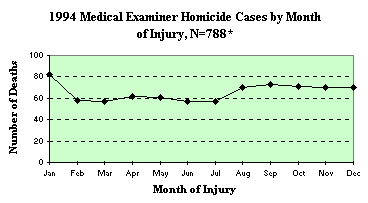
Homicides by hour of injury are shown in Figure 9. It can be seen that the hours around and including midnight had the highest frequency of homicides. Figure 10 shows that the highest frequency of homicides occurred on weekends. (The day is defined as beginning at 6 a.m. rather than midnight because activities in the early morning hours are usually continuing from the preceding day.) The peak months for homicides are usually summer though 1994 showed a peak in January and the early fall (Figure 11).
Figure 10
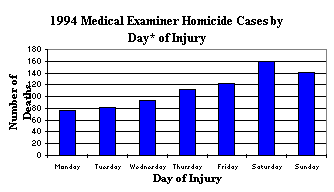
*Day runs from 6:00am -5:59 am
Figure 11
*Total number for which month is known